Integration is complex and identifying an issue is even harder. With APPSeCONNECT, we try to provide tools and features that can help in identifying the issues while executing an integration. The platform gives you features like capturing network traffic from the APPSeCONNECT agent, sync snapshots, sync info, logs, etc which can give you insights into the issues that happened while executing a task.
Sometimes it is important to look at logs that will give user-friendly messaging to a request while sometimes the complexity is so much, that you even want to inspect the request/response packet. One option is to use the Snapshot which is available in the cloud environment. But sometimes you prefer to directly look into the structure for a more granular view of the packets. Here comes the importance of tools like Fiddler. Let’s see how Fiddler can help capture network traffic from APPSeCONNECT.
What is a Fiddler & How to Use it for Network Traffic?
Fiddler is a network proxy tool that traces the HTTPS and HTTP request and response structures. That means if you open fiddler, it creates a Proxy on the localhost and any network call will be moved through that local Proxy and the Fiddler tool will trace the exact request and response during transit.
It should be noted, using fiddler might affect the way APPSeCONNECT communicates the data to the external application. The proxy it creates might slow down the actual integration or even fail a successful data integration. It is recommended to trace data packets only when you are out of other options.
You can download fiddler from here.
Connect all your business applications under one single platform to automate the business process and increase your productivity and efficiency!
Configuring Fiddler for Network Traffic Tracing
To use fiddler, you want to configure it correctly, such that any data passed through APPSeCONN’ECT can be traced correctly. Here are the steps to configure fiddler.
1. Download and install Fiddler from their website, http://www.telerik.com/download/fiddler
2. Open the Fiddler tool.
3. In Fiddler, go to “Tools” > “Options”
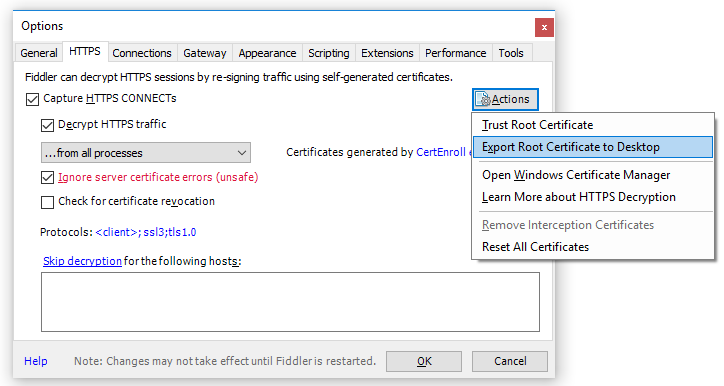
4. Click the “HTTPS” tab and check “Capture HTTPS CONNECTs”
5. Check the option for “Decrypt HTTPS traffic”. Once you do, it will ask to install certificates, you can install them on your local system.
6. Click on the “Actions” button > Export Root Certificate to Desktop”

7. Go to the “Gateway” tab and select the option for “Use System Proxy (recommended)”
8. Click OK
9. Go to “File” and uncheck the “Capture Traffic” option. This will block all browsing (internet-enabled applications) from being tracked and only show direct traffic to/from the atom
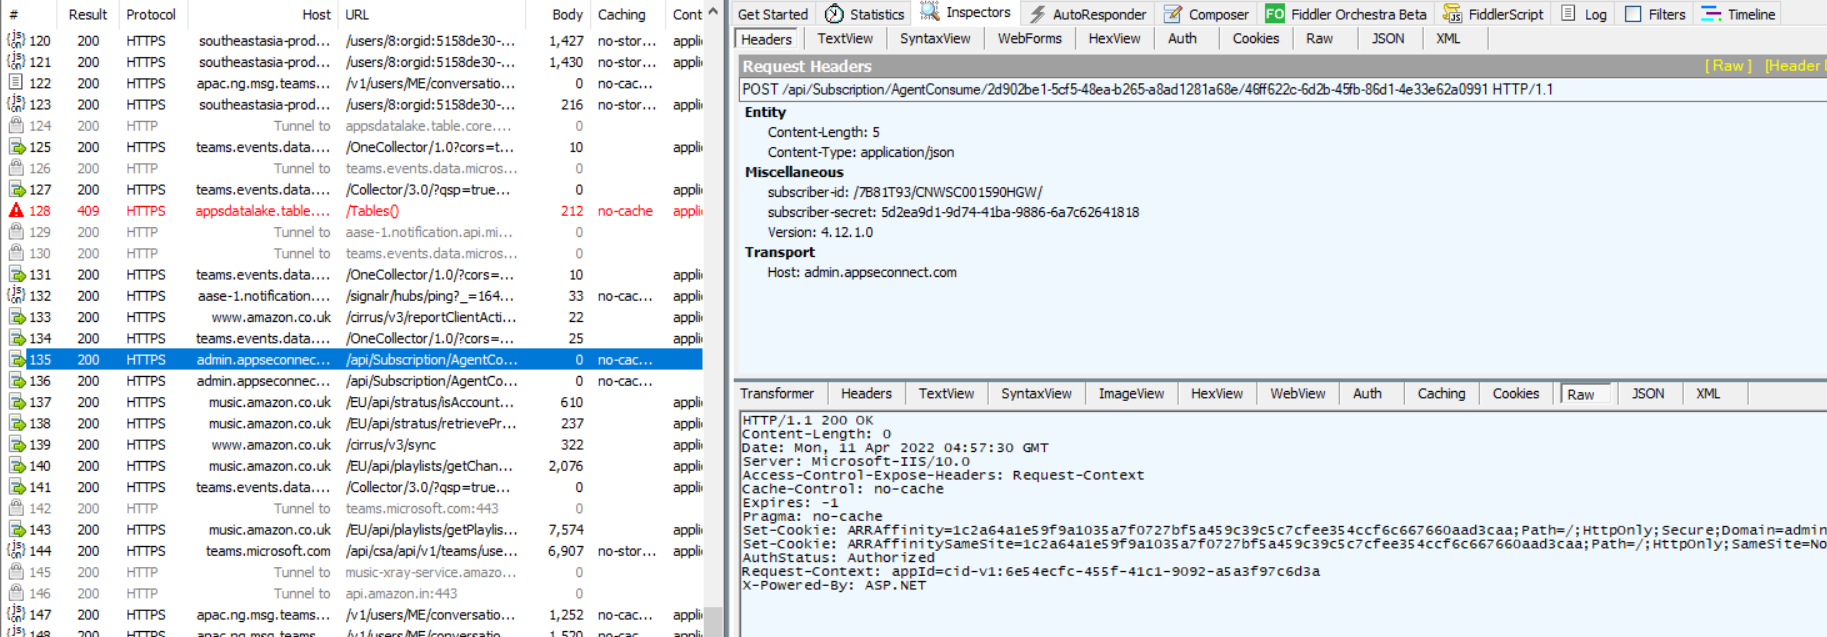
10. Once this is done, in most cases, you will see the Fiddler started capturing the network activities.
Configuring APPSeCONNECT
In most cases, you do not need to configure APPSeCONNECT. But if you still cannot see the network activities from APPSeCONNECT in fiddler, sometimes it might be important to add a proxy explicitly in the platform to ensure it uses Fiddler always to send data. To configure APPSeCONNECT for fiddler, follow the steps:
1. Open the Environment where you want to configure Fiddler.
2. Go to Settings in APPSeCONNECT and Uncheck “Enable Environment”.
3. Navigate to the APPSeCONNCT folder in Program Files(x86) of the system drive and find the file “InSync.eConnect.AutoSync.exe.config”
4. Open the file and add the following entry to the file –
<system.net>

<defaultProxy enabled="true">

<proxy proxyaddress="http://127.0.0.1:8888" bypassonlocal="False"/>

</defaultProxy>

<settings>

<httpWebRequest useUnsafeHeaderParsing="true" />

</settings>

</system.net>
Be sure you check the system.net node before adding the content. The file should not contain more than one entry for any node.
5. When you try to save the file, it won’t be allowed directly into the Program Files folder. Try to save in “Desktop”.
6. Copy the file from Desktop and paste it into the Program Files(x86)\APPSeCONNECT folder.
7. Finally, start APPSeCONNECT and Enable the Environment again.
8. Restart Fiddler and execute the ProcessFlow in Manual or Runtime Filter mode.
The Fiddler should start capturing the data from now.

You can see the entire Request / Response structure on the right by choosing the correct entry on the left. There are tabs explaining both the structure. Raw is the tab that shows the entire request/response in either of the section.
I hope this will help.
Thank you.
Connect all your business applications under one single platform to automate the business process and increase your productivity and efficiency!


